Project-starts return to decline
– The value of underlying work starting on-site during Q2 2022 fell 5% against the preceding three months to stand 27% lower than a year ago.
– While residential project-starts increased 17% against the preceding three-month period, the value remained 21% down on the previous year.
– Non-residential construction-starts fell by more than a fifth (-22%) compared with Q1 and declined 29% against the previous year.
– Infrastructure project-starts performed particularly poorly in Q2, falling 27% against the preceding three months to stand 47% lower than a year ago.
Return to Decline
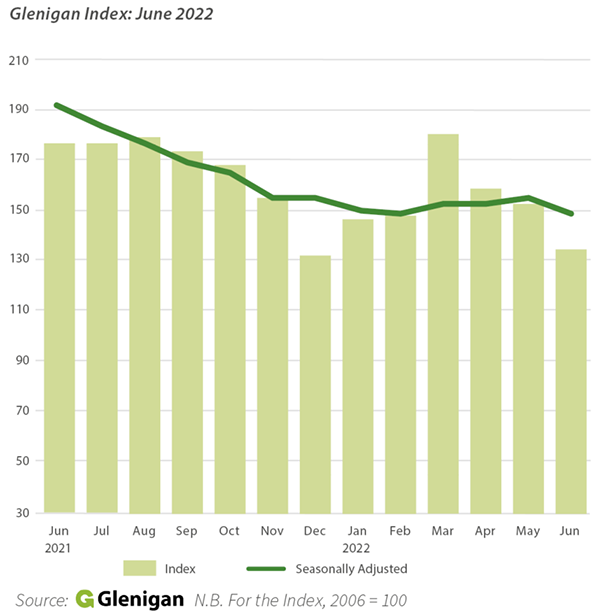
The July Index sees the industry in a state of decline once again. Despite a modest uptick registered last month, construction material inflation, currently riding at 25% y-o-y, continues to disrupt output levels, and is the primary cause for this recent fall.
Overall, the value of underlying work starting on-site during Q.2 2022 fell 5% against the preceding three months to stand 27% lower than a year ago.
Whilst the silver lining of strong growth in private housing starts is an indicator of isolated vertical uplift, this positive result is tempered by poor performance across almost all other non-residential sectors.
The effects of the Russia-Ukraine War are still hindering consistent recovery, with resulting material shortages and supply chain delays significantly affecting project-start levels nationwide. Closer to home, imminent regime change at the top of the UK Government and the appointment of yet another housing and construction minister will no doubt create further disruption in the short term.
It’s clear there’s still some way to go before the sector returns to consistent growth. However, a strong developmental pipeline of planning approvals and contract awards, registered in Glenigan’s previous Indexes, Reviews and most recent Forecast, suggests activity will pick-up by mid-2023, reviving industry fortunes.
Sector analysis – Residential
The overall value of residential project-starts improved during Q.2, rising 17% against the preceding quarter. However the value remained 21% lower than the previous year.
Private housing was the July Index’s stand-out performer, with work starting on-site increasing 43% compared to Q.1 despite falling 14% against Q.2 2021.
Conversely, social housing project-starts performed poorly, slipping back 42% against both the preceding quarter and the previous year.
Sector Analysis – Non- Residential
Performance in non-residential sectors was generally poor.
Retail was the only vertical to achieve growth against the preceding quarter (+6%), despite project-starts remaining 28% lower than a year ago.
Community and amenity starts experiences a modest decline on Q.1 activity, but were, positively, up 21% against the previous year.
Health construction starts remained unchanged on the preceding quarter, with the value falling by a quarter against 2021. This was partly mirrored by industrial project-starts which, in addition to declining 25% against the previous year, also plummeted 36% against Q.1. This represented the greatest drop of any non-residential vertical.
Hotel and Leisure (-32%), offices (-25%) and education (-21%) also witnessed strong declines during Q.2 to stand 40%, 30% and 32% lower respectively than a year ago.
Civils experienced a very poor period for project-starts with the value having the greatest declines against both the preceding quarter (-27%) and previous year (-47%). Utilities suffered the weakest period, with project-starts falling 30% during Q.2, standing at almost half (-48%) the value of the previous year. Similarly, infrastructure-starts fell by a quarter against the preceding quarter and 46% compared with a year ago.
Regional Outlook
Q.2 performance was mixed across UK regions. Positively, England’s northernmost areas performed well, with 7% and 2% growth against Q.1 observed in the North East and the North West. However here’s where the similarity ended, with the former falling 2% against 2021, whilst the latter was up 2%.
Northern Ireland also experienced a strong period, with growth of 3% against the previous quarter and a massive 44% rise against last year.
The South West was also up 11% in Q.2, but lagged a third behind 2021 performance. In the East Midlands, construction starts remained unchanged against the preceding quarter but experienced the greatest decline (-47%) compared to 2021.
Both London (-30%) and Yorkshire & Humber (-32%) performed particularly poorly in Q.2. Not only were both significantly down on Q.1, but they also showed a decline against 2021 figures, -45% and -43% respectively.
Commenting on the results of the July 2022 Index, Glenigan’s Senior Economist Rhys Gadsby says, “No doubt many will be disappointed that the modest uptick registered in June’s Index has not lasted. However, with so many global challenges to face it would have been naïve to suggest that we would be returning to consistent growth just yet. However, there are some bright spots, particularly in the private housing sector where a burst of activity can probably be attributed to developers nationwide initiating work ahead of new building regulations. Elsewhere, whilst project-start levels continue to remain depressed, a strengthening pipeline of planned activity will no doubt, as per our UK Construction Industry Forecast 2022-2024, provide a much needed shot in the arm for the sector over the next six months and into 2023.”
Glenigan Indices (underlying* projects up to £100 million)
|
|
Glenigan Index |
Residential |
Non-residential |
Civil engineering |
||||
|
|
Index |
% Change |
Index |
% Change |
Index |
% Change |
Index |
% Change |
|
Jun-21 |
179.1 |
74% |
246 |
87% |
129 |
72% |
190 |
40% |
|
Jul-21 |
179.0 |
60% |
241 |
63% |
137 |
63% |
168 |
39% |
|
Aug-21 |
181.4 |
39% |
256 |
42% |
141 |
42% |
127 |
12% |
|
Sep-21 |
176.0 |
25% |
245 |
21% |
139 |
39% |
125 |
-5% |
|
Oct-21 |
169.5 |
6% |
238 |
4% |
133 |
20% |
119 |
-28% |
|
Nov-21 |
156.4 |
-6% |
208 |
-16% |
123 |
15% |
140 |
-18% |
|
Dec-21 |
133.6 |
-4% |
186 |
-11% |
101 |
9% |
117 |
-12% |
|
Jan-22 |
148.4 |
-7% |
192 |
-23% |
122 |
24% |
127 |
-13% |
|
Feb-22 |
149.5 |
-11% |
187 |
-27% |
132 |
25% |
111 |
-32% |
|
Mar-22 |
182.8 |
-13% |
227 |
-31% |
158 |
21% |
154 |
-17% |
|
Apr-22 |
160.7 |
-17% |
204 |
-31% |
132 |
7% |
152 |
-18% |
|
May-22 |
153.1 |
-21% |
201 |
-29% |
117 |
-9% |
162 |
-14% |
|
Jun-22 |
130.8 |
-27% |
195 |
-21% |
91 |
-29% |
102 |
-47% |