Recovery in project-starts continues
– The value of underlying work (under £100 million) starting on-site during the three months to October was 14% lower than a year ago, however increased by 26% compared to the preceding three months on a seasonally adjusted basis.
– Residential starts declined 16% against the previous year but increased 35% on the preceding three months.
– Non-residential work commencing on-site climbed 10% on the preceding three months but declined by a fifth compared to the previous year.
– Civil engineering experienced a strong three months, rising 22% on the previous year and 52% against the preceding three months.
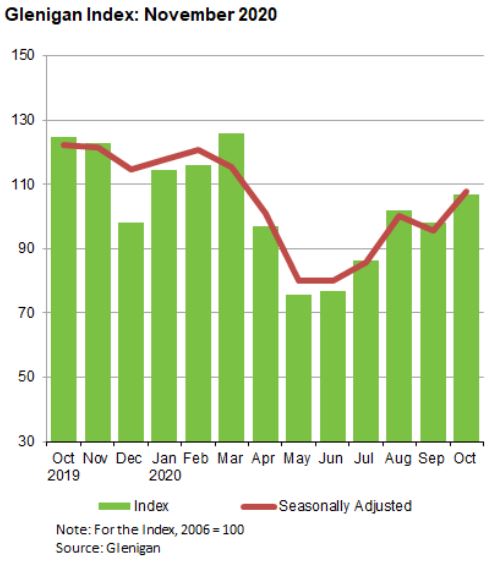
The three months to October marked a strong recovery in the value of work starting on-site in all sectors and regions against the lows of the previous three month period. The value of construction work starting on-site in October alone was almost double that of May.
Project-starts are still heavily below pre-pandemic levels, but the gap is narrowing. The value of work commencing on-site in October was 14% lower than a year ago, whereas in May construction-starts were 46% lower. However, with the winter period now approaching, Britain’s relationship with the European Union still uncertain and with the initial backlog of delayed project-starts now cleared, we anticipate growth to be slow over the coming months through to 2021.
Non-residential projects commencing on-site declined by 20% compared to a year ago, but climbed 10% on the preceding three months (seasonally adjusted).
The health sector experienced the biggest rise in the value of project-starts against the previous year, rising 30%. Starts also increased 37% against the preceding three months.
Office starts during the three months to October climbed 6% against the previous year and 47% compared to the preceding three months.
The value of hotel & leisure project-starts experienced the sharpest fall of any sector, declining 54% compared to a year ago. Work commencing on-site also declined by a quarter against the preceding three months.
Education starts also suffered steep declines of 32% against the previous year and 17% compared to the preceding three months.”
The civil engineering sector experienced an exceptional three months to October, with the value of work starting on-site increasing 22% on the previous year and 52% on the preceding three months on a seasonally adjusted basis.
The value of utilities project-starts experienced the greatest rise against the preceding three months of any sector, rising 122%. Starts also climbed 8% compared to a year ago.
Infrastructure work commencing on-site increased 30% on the previous year and 28% on the preceding three months.
UK Regions start to return to growth
The value of project-starts in most UK regions were still lower than a year ago. However, a few regions achieved growth for the first time since the national lockdown began in March.
Construction-starts in Wales experienced the greatest rise with an increase of 24% compared to a year ago. Against the preceding three months (seasonally adjusted) starts climbed 12%.
The West Midlands and South West also had a relatively good three months to October, with the value of starts rising 7% and remaining unchanged on the previous year respectively. Work commencing on-site increased by 55% in the West Midlands and 52% in the South West compared to the preceding three months.
Despite a fall in the value of project-starts of 15% on the previous year, Scotland experienced the sharpest growth against the preceding three month period with a rise of 74%.
Work starting on-site in the East Midlands during the three months to October declined 38% against the previous year; the heaviest fall of any region. Starts fell 27% in both the East of England and North West.
The East Midlands, South East and North East were the only three regions to experience declines in the value of project-starts compared to the preceding three months, with falls of 2%, 6% and 8% respectively.
Glenigan Indices (underlying* projects up to £100 million)
|
|
Glenigan Index |
Residential |
Non-residential |
Civil engineering |
||||
|
|
Index |
% Change |
Index |
% Change |
Index |
% Change |
Index |
% Change |
|
Oct-19 |
124.7 |
-12% |
153 |
-11% |
110 |
-18% |
101 |
30% |
|
Nov-19 |
122.7 |
-14% |
140 |
-17% |
111 |
-16% |
122 |
18% |
|
Dec-19 |
98.0 |
-20% |
113 |
-25% |
89 |
-18% |
92 |
-3% |
|
Jan-20 |
114.4 |
-13% |
130 |
-19% |
104 |
-5% |
113 |
-19% |
|
Feb-20 |
116.1 |
-13% |
137 |
-16% |
103 |
-5% |
111 |
-28% |
|
Mar-20 |
125.7 |
-18% |
147 |
-16% |
107 |
-18% |
142 |
-26% |
|
Apr-20 |
97.0 |
-33% |
115 |
-34% |
77 |
-36% |
128 |
-17% |
|
May-20 |
75.5 |
-46% |
86 |
-50% |
57 |
-51% |
124 |
-13% |
|
Jun-20 |
76.7 |
-47% |
81 |
-56% |
66 |
-44% |
108 |
-16% |
|
Jul-20 |
86.3 |
-44% |
96 |
-50% |
78 |
-38% |
93 |
-38% |
|
Aug-20 |
101.7 |
-33% |
117 |
-41% |
93 |
-25% |
91 |
-32% |
|
Sep-20 |
98.0 |
-35% |
117 |
-40% |
82 |
-33% |
108 |
-19% |
|
Oct-20 |
106.8 |
-14% |
128 |
-16% |
88 |
-20% |
123 |
22% |