Project-starts remain low as inflationary pressures continue
– The value of underlying work commencing on-site during the three months to April fell 1% against the preceding three months on a seasonally adjusted (SA) basis to stand 21% lower than a year ago
– Residential project-starts improved on the preceding three months (+9%) but remained 28% lower than a year ago
– Non-residential project-starts fell 9% during the period as well as 8% against the previous year
– Civil engineering work starting on-site continued to weaken, having fallen 13% against the preceding three months and 28% on a year ago
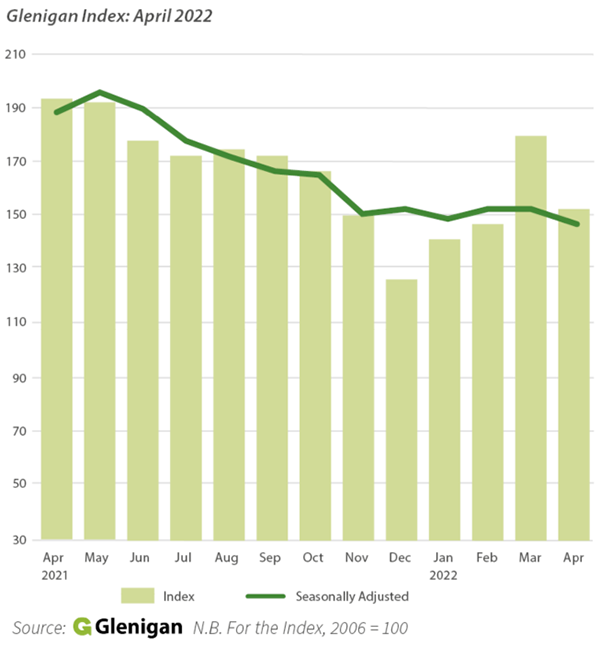
The May Index paints a decidedly gloomy picture, standing in stark contrast to the relative post-COVID optimism of Spring/Summer 2021.
Increased pressure on household budgets, coupled with soaring labour and material costs, continues to negatively affect consumer confidence. This has led to unease among investors in consumer-related verticals, significantly delaying project-starts across the UK.
This situation is likely to remain unchanged over the coming months, as external influences, particularly the Russia-Ukraine War, continue to squeeze industry supply chains.
Against this backdrop of disruption, starts remain significantly lower than last year for the sixth consecutive month, with April 2022 posting the worst index during that period.
Sector Analysis – Residential Recovery
Residential work commencing on-site in the first month of Q.2 2022 experienced minor improved performance against the previous quarter (+9%), but was down 28% on the previous year, representing the joint-greatest drop of sectors covered by the Index.
Social housing construction-starts continued to decline, falling 13% against the last quarter.
However, there were silver linings to be seen edging through the cloudy outlook, with private housing-starts showing signs of revival with strong growth (+18%) compared to the preceding three months.
Sector Analysis – Offices still on the Rise
Maintaining its upward trend, office project-starts experienced the greatest growth period of any vertical in the past quarter, increasing by half (50%) against the previous three months to stand 19% up on a year ago.
Indeed, it was the only vertical to experience growth against both periods.
Hotel and leisure project-starts continued to decline after an initial burst of activity at the outset of 2022, with a fall of nearly a third (30%) from the preceding quarter. However, there was a value-increase of 10% against the previous year, indicating the vertical is starting to recover following the effects of the Pandemic.
Similarly, retail construction-starts remained low on the year before, with a decrease of 4%, but increased by over a tenth (13%) against the previous three months.
Industrial starts faltered on the strong performance seen in recent months, experiencing a fall of nearly a quarter (24%) against the previous three months, dropping 17% compared with the same period in 2021.
Infrastructure starts continued to steadily decline, down 4% compared with the last quarter to stand 27% lower than a year ago.
Civil works also performed poorly, with the value of projects commencing on-site falling 13% during this quarter, to stand -28% lower than a year ago. A significant driver for this decline was poor performance in utilities which remained a third lower on 2021, and work starting on-site slipping back by 29% against the last quarter.
Health, education, community & amenity construction-starts were also down against both the previous quarter and the previous year.
Regional Outlook
The North East continued to be the strongest-performing region in the UK, experiencing a project-starts value increase of 44% against the preceding quarter, to stand 3% up on this time last year.
The outlook for Northern Ireland is also optimistic, as the only other region to experience growth against the previous three months (+7%), as well as over a third (34%) growth on 2021.
The West Midlands recovered from consistently poor performance in Q.1, experiencing growth of nearly a third (27%) against the preceding quarter. Despite this, the region saw a value decrease of 9% on the year before. The East Midlands also saw growth on the previous quarter, but only by 1%.
The North West experienced particularly poor performance, with the value of project-starts falling 18% against the previous three months and by a fifth compared with the same time last year. This was the steepest decline of any region compared with Q.1.
Work starting on-site in the South West (-41%), Yorkshire & the Humber (-39%) and Scotland (-30%) all remained distinctly behind statistics from the previous year.
Commenting on the Index’s findings, Glenigan’s Senior Economist, Rhys Gadsby said “This month we have continued to see project-starts remain low as rising material and labour costs prolong delays across the industry. As with April’s Index, we have failed to see the traditional spring uptick propel starts this month, and the UK has continued to feel the ramifications of the Coronavirus pandemic and the ongoing conflict in Ukraine. Increased inflationary pressures and rising energy costs have put considerable stress on household budgets, and we have seen this severely impact both consumer and investor confidence at the start of this new quarter.
“Despite a general reluctance to move consumer sector projects to site, there is evidence of bounce back in the residential sector, with private housing showing signs of improvement. On a regional level, the North East continues to demonstrate consistent improvement, while Northern Ireland has started to catch up on growth compared to 2021.
“Although external factors have continued to frustrate the industry, construction has consistently invented creative solutions to its problems, and I am confident that the UK will continue to forge a path through these global crises.”
Glenigan Indices (underlying* projects up to £100 million)
|
|
Glenigan Index |
Residential |
Non-residential |
Civil engineering |
||||
|
|
Index |
% Change |
Index |
% Change |
Index |
% Change |
Index |
% Change |
|
Apr-21 |
194.0 |
37% |
297 |
46% |
123 |
25% |
184 |
36% |
|
May-21 |
192.7 |
73% |
286 |
86% |
128 |
71% |
187 |
34% |
|
Jun-21 |
177.4 |
72% |
246 |
86% |
127 |
71% |
183 |
34% |
|
Jul-21 |
172.0 |
54% |
235 |
59% |
130 |
54% |
160 |
32% |
|
Aug-21 |
174.0 |
33% |
247 |
37% |
135 |
36% |
120 |
6% |
|
Sep-21 |
171.9 |
22% |
237 |
17% |
135 |
36% |
131 |
0% |
|
Oct-21 |
166.8 |
4% |
229 |
0% |
132 |
20% |
126 |
-24% |
|
Nov-21 |
150.5 |
-9% |
200 |
-19% |
117 |
9% |
143 |
-16% |
|
Dec-21 |
126.4 |
-10% |
172 |
-18% |
96 |
5% |
115 |
-13% |
|
Jan-22 |
141.6 |
-11% |
179 |
-28% |
118 |
20% |
131 |
-10% |
|
Feb-22 |
147.5 |
-12% |
188 |
-27% |
125 |
19% |
121 |
-25% |
|
Mar-22 |
179.5 |
-15% |
233 |
-30% |
149 |
14% |
148 |
-21% |
|
Apr-22 |
152.4 |
-21% |
214 |
-28% |
113 |
-8% |
132 |
-28% |