Weak start to the year
- Starts in the three months to January were 14% down on a year ago and 11% lower than the preceding three months.
- Residential starts were 14% lower than a year ago and 9% down on the preceding three months.
- Non-residential project starts were 13% lower than a year ago as growth in industrial and office starts was overshadowed by declines in other sectors.
- Civil engineering was 14% lower than a year ago but 23% up on the preceding three months.
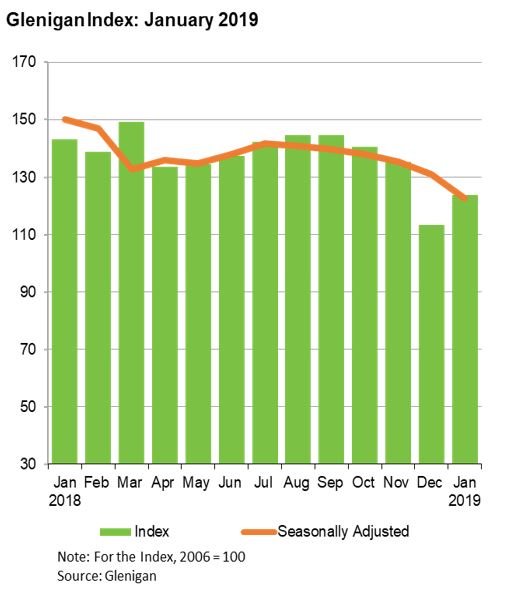
The value of work starting on site in the three months to January was 14% lower than a year earlier, according to the latest Glenigan Index. Starts fell 11% against the previous three months on a seasonally adjusted basis.
Commenting on this month’s figures, Allan Wilén, Glenigan’s Economics Director, said: “The Glenigan Index reveals a subdued start to the year, with a widespread weakening in project starts across most parts of the country and different sectors. Weak economic growth and continued political uncertainty appears to be dampening construction activity in particular with declines in private housing and non-residential projects. In contrast civil engineering projects starts increased against the previous three months, although they were down on a year ago.
“Private residential starts during the three months to January were 20% down on the same period a year ago. On a seasonally adjusted basis starts were 15% lower than during the three months to October. The decline in project starts since last autumn is against a backdrop of fewer property transactions and weaker house price inflation in the wider housing market. Political and economic uncertainties are expected to continue to dampen housing market activity and project starts in the near term, but the recent extension of Help to Buy to 2023 should help support project starts as the UK economic outlook becomes clearer. In contrast, social housing starts rose 7% against the three months to October and matched the level seen a year ago.
“Overall non-residential projects dropped 18% against the preceding three months on a seasonally adjusted basis and were 13% lower than a year ago. The industrial and office sectors were two bright spots, with starts rising 6% and 20% respectively against a year ago. Other non-residential sectors saw double-digit declines in project starts. The sharpest declines were in community & amenity and hotel & leisure starts which declined by 58% and 31% respectively.
“Civil engineering starts rose 23% against the months to October on a seasonally adjusted basis but were 14% down against a relatively strong performance a year ago. The recent rise in project starts has been led by a sharp increase in the utilities sector with starts rising 75% against the previous three months. Infrastructure starts rose 11% over the same period.”
Whilst most parts of the UK saw falls in the value of project starts against a year ago, starts rose in the South East (5%), the North West (3%) and West Midlands (14%). Regionally the sharpest falls were in London, South West and Scotland with starts declining by 32%, 21% and 26% respectively against a year ago.
Glenigan Indices (underlying* projects up to £100 million)
|
|
Glenigan Index |
Residential |
Non-residential |
Civil engineering |
||||
|
|
Index |
% Change |
Index |
% Change |
Index |
% Change |
Index |
% Change |
|
Dec-17 |
143.2 |
-13% |
185 |
-11% |
123 |
-14% |
105 |
-22% |
|
Feb-18 |
138.8 |
-10% |
181 |
-11% |
119 |
-6% |
94 |
-22% |
|
Mar-18 |
149.3 |
-15% |
185 |
-16% |
129 |
-13% |
127 |
-23% |
|
Apr-18 |
133.7 |
-9% |
162 |
-10% |
120 |
1% |
104 |
-32% |
|
May-18 |
134.4 |
-13% |
156 |
-15% |
124 |
-7% |
112 |
-28% |
|
Jun-18 |
137.4 |
-9% |
167 |
-18% |
121 |
-1% |
117 |
2% |
|
Jul-18 |
142.3 |
-9% |
177 |
-16% |
119 |
-7% |
134 |
34% |
|
Aug-18 |
144.6 |
-6% |
182 |
-16% |
124 |
1% |
120 |
21% |
|
Sep-18 |
144.8 |
-4% |
179 |
-10% |
133 |
7% |
93 |
-22% |
|
Oct-18 |
140.6 |
0% |
171 |
-12% |
134 |
20% |
77 |
-30% |
|
Nov-18 |
135.4 |
-2% |
158 |
-14% |
129 |
17% |
95 |
-14% |
|
Dec-18 |
113.3 |
-8% |
136 |
-18% |
103 |
2% |
91 |
8% |
|
Jan-19 |
123.7 |
-14% |
158 |
-14% |
107 |
-13% |
91 |
-14% |