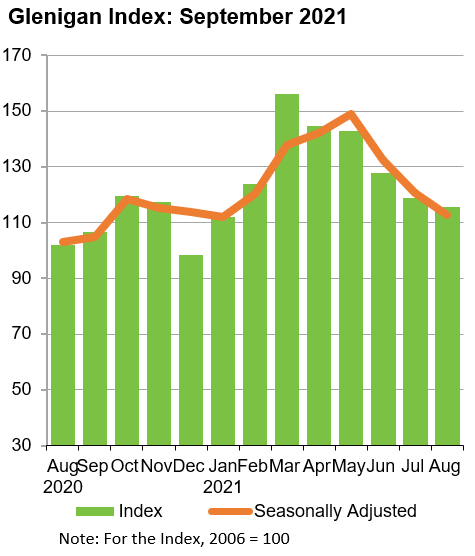
Decline in project-starts continues to slow
– The value of underlying work starting on-site declined against the preceding three months, on a seasonally adjusted (SA) basis, but at a slower rate than in recent months, suggesting that we are nearing the end of the decline.
– Residential project-starts declined 24% against the preceding three months (SA) and 23% compared with the same period in 2019. Despite this, the value remained 26% up on a year ago..
– Non-residential work commencing on-site increased 4% against a year ago but fell 23% against the preceding three months (SA). The value also fell 22% against the same period in 2019.
– Civil engineering project-starts fell 28% against the preceding three months (SA) as well as 38% compared with two years ago. Despite this, the value still increased 6% against a year ago.
Project-starts have consistently declined across most regions and sectors over the last five months. While a decline was anticipated following the initial surge in starts during the first quarter, materials and labour issues have also contributed to the recent fall.
Project-starts remained largely up on the previous year across the sectors and regions, and while the value still declined in August, the decline is slowing, suggesting that we are nearing the end of the decline. Rising business confidence as well as a very high level of main contract awards should help reverse the trend heading into the final months of the year.
Sector Performance
The value of residential work starting on-site during the three months to September increased 26% against last year. However, the value declined 23% compared with the same period in 2019 as well as 24% against the preceding three-month period (SA). Social housing performed relatively well, with project-starts having increased 8% against the preceding three months (SA) and 18% compared with the previous year. Social housing-starts fell 9% against the same period in 2019, although this was a relatively small decline compared with other sectors. Private housing work starting on-site climbed 29% against the previous year. However, the value fell 28% against the same period in 2019 as well as by a third compared with the preceding three months (SA).
Non-residential project-starts climbed 4% against the previous year but declined by 22% compared with the same period in 2019 as well as by 23% against the preceding three months (SA). Health was the stand-out non-residential sector during the period, with the value of project-starts having increased 9% against the preceding three months (SA) to stand 3% up on the previous year. In addition, health starts were 89% higher than during the same period in 2019. Retail project-starts also performed well, having increased 55% against the previous year and 15% compared with the same period in 2019. However, the value fell 30% compared with the preceding three-month period (SA).
While hotel & leisure project-starts climbed 52% against the previous year, the value fell 16% against the same period in 2019. More positively, other than social housing and health, hotel & leisure was the only other sector to achieve growth against the preceding three months on a seasonally adjusted basis (9%). In contrast, office starts performed poorly having fallen 24% against the previous year and 44% compared with the preceding three-month period (SA) to stand 41% below 2019 levels. Education and community & amenity were the only other non-residential sectors to experience declines against the previous year.
Civil engineering project-starts climbed 6% against the previous year but experienced a 28% fall compared with the same period in 2019 and against the preceding three months (SA). Infrastructure project-starts performed very poorly, falling by 48% against the preceding three-month period (SA) to stand 22% lower than a year ago and 49% below 2019 levels. Arguably, this was one of the worst performances of any sector during the three months to September. In contrast, utilities project-starts climbed 81% against the previous year and 25% compared with the preceding three months (SA). However, utilities-starts still fell 18% against the same period in 2019.
Regional Performance
While the majority of regions experienced growth in project-starts against the previous year, all witnessed declines compared with the same period in 2019. Project-starts in the North West performed very well, with growth of 39% against the previous year and 27% compared with the preceding three months (SA). The region was the only to experience growth against the preceding three months and was the best-performing region against the previous year. Project-starts in the region remained 9% behind 2019 levels. The North East also performed well against the previous year with growth of 30%, however the value fell 38% against the preceding three months (SA) and by a third compared with the same period in 2019.
The East of England, West Midlands and Yorkshire & the Humber experienced strong increases against the previous year but declines against both the preceding three months and two years ago. While the two most-northern regions of England performed relatively well, the South East and South West performed poorly with declines of 3% and 1% against the previous year respectively. Project-starts fell by a quarter against the preceding three months (SA) in both regions. While the value remained 31% below 2019 levels in the South East, project-starts were only 6% down on the same period in 2019 in the South West.
Glenigan Indices (underlying* projects up to £100 million)
|
|
Glenigan Index |
Residential |
Non-residential |
Civil engineering |
||||
|
|
Index |
% Change |
Index |
% Change |
Index |
% Change |
Index |
% Change |
|
Aug-20 |
102.0 |
-33% |
119 |
-40% |
93 |
-25% |
88 |
-34% |
|
Sep-20 |
106.5 |
-29% |
130 |
-33% |
88 |
-28% |
113 |
-15% |
|
Oct-20 |
119.6 |
-4% |
142 |
-7% |
98 |
-11% |
144 |
42% |
|
Nov-20 |
117.4 |
-4% |
146 |
4% |
91 |
-18% |
145 |
19% |
|
Dec-20 |
98.3 |
0% |
121 |
7% |
81 |
-9% |
104 |
13% |
|
Jan-21 |
112.0 |
-2% |
151 |
16% |
83 |
-20% |
119 |
5% |
|
Feb-21 |
123.8 |
7% |
165 |
21% |
91 |
-11% |
139 |
25% |
|
Mar-21 |
156.1 |
24% |
210 |
43% |
113 |
5% |
177 |
24% |
|
Apr-21 |
144.7 |
49% |
186 |
62% |
107 |
39% |
178 |
39% |
|
May-21 |
142.7 |
89% |
172 |
101% |
112 |
96% |
185 |
50% |
|
Jun-21 |
127.7 |
66% |
141 |
74% |
109 |
64% |
169 |
56% |
|
Jul-21 |
118.7 |
39% |
126 |
33% |
110 |
42% |
134 |
50% |
|
Aug-21 |
115.6 |
13% |
149 |
26% |
97 |
4% |
93 |
6% |